
Bitcoin is likely to swing back to the upside… So, the Xbit AI took a long position last night!
Below are the scenarios we thought possible yesterday before Xbit made its move;
Scenarios
1. Support around $ 8,300, before rebounding.
2. Support around $ 8000-8100, before rebounding.
3. Break below support at around $ 8000-8100.
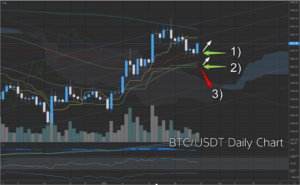
Let’s Review
1. Support around $ 8,300, before rebounding.
This was our best-case scenario, but after watching price action until noon yesterday, I didn’t think that this scenario was likely to materialize. Suddenly late last night the situation started to look more positive. Xbit pulled the triggered and we took a position. With support around $8,300, we feel this rally could run to $10,000.
At around $ 8,300 there’s 20-day EMA (exponential moving average) and trend line support. In addition, although the reference line and the turning line in the Ichimoku Balance Table are still diverging, it is almost certain that the divergence will decrease as the reference line starts to rise (within a few days). So the team thinks this is no problem. You can also see the MACD is forming a death cross, but at this point we are not putting a lot of faith in daily MACD numbers.
You might be thinking why I think scenario 1 looks most likely…
I think I should start by explaining scenarios 2 and 3 first.
2. Support around $ 8000-8100, before turning positive.
In Scenario 2, around 8000-8100 dollars, important support such as the Ichimoku Balance Table Baseline, 20-Day SMMA (Smooth Moving Average), and 100-Day Moving Average all converge. I thought we were most likely to be supported in this price range, even lower than yesterday’s daily decision (9:00 am Japan time), but luckily this didn’t materialize.
3. Break below support at around $ 8000-8100.
Scenario 3 seemed unlikely, but it’s best to always be prepared for the worst. In this case, the next support would be around the inverted triad bottom neckline of $ 7700.
How to determine support
So, how do you judge support strength? The support line is usually chosen on a daily chart, but simply setting a support line when a security turns positive is too weak an indicator to be consistently reliable.
Of course it’s essential that the price reverses from the support line and rises, but we don’t consider it solid support point until the price breaks through the resistance line (on a shorter time-frame chart) and rebounds back above the support line on a daily chart. (Of course, depending on the situation, traders may judge the situation differently).

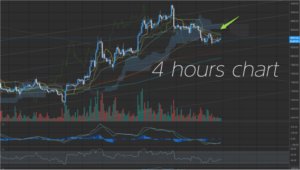
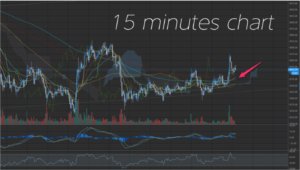
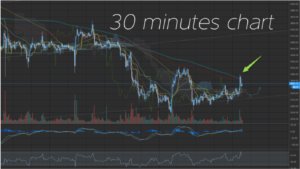
Above, you will find the 4-hour, 1-hour, 30-minute, and 15-minute chart as of 20:00 on the 26th. At this point, the 15-minute chart has broken an important resistance line. Normally, we would be looking for confirmation on the 30 minute chart, but at this point, we haven’t broken through the resistance.
After another 30 minutes, the resistance line had been broken for an hour, and Xbit AI signaled the first long position maker. The stop loss order at this time is a bit tight. The breakthrough of resistance on the 4-hour chart was confirmed at 5:00 am, Japan time. After crossing this threshold, Xbit placed a second long position.
Remember – It always makes sense to confirm a breakthrough on a second chart before pulling the trigger on a trade.
Looking Forward
When it comes to trading, things often don’t go as expected. I had a feeling we would trend down and see support at around $ 8,100. The important thing is to stick to your investment strategy. If Xbit says ‘buy’ we review the AI recommendation for obvious errors and then approve the trade.
What’s next? It’s time to hunt for an exit ramp. We will be watching Xbit AI’s algorithms carefully for a signal.
– Xbit Strategy Team